16.1. Dashboard
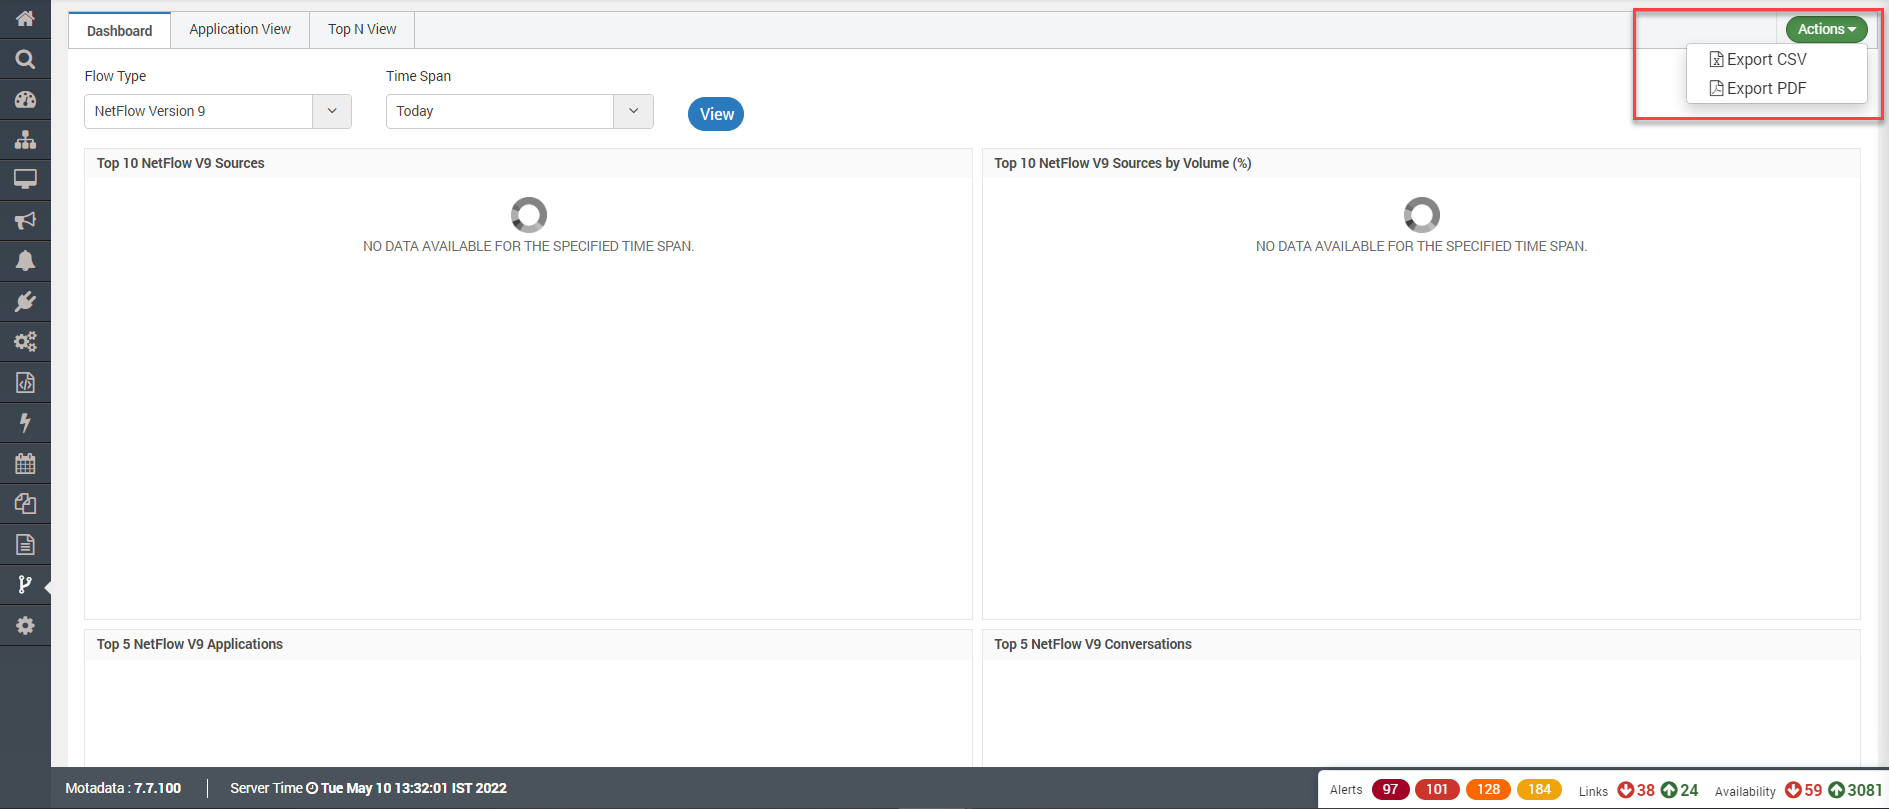
The Dashboard shows the quick view of the flow visualization for top activities. You can choose the Flow Type and the time span.
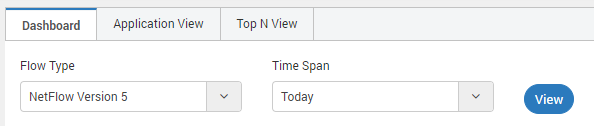
Choose Flow Type and Time Span
Flow Type
The type of flow for which you want to create a dashboard. The options available are:
NetFlow Version 5
NetFlow Version 9
sFlow
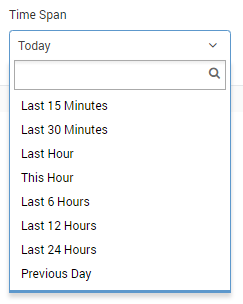
Time Span
Select the timespan from the given list.
Flow Time Span
The dashboard contains different widgets for quick display of information. You can download the widget information into CSV, JPG or PNG using the download icon.
Sources
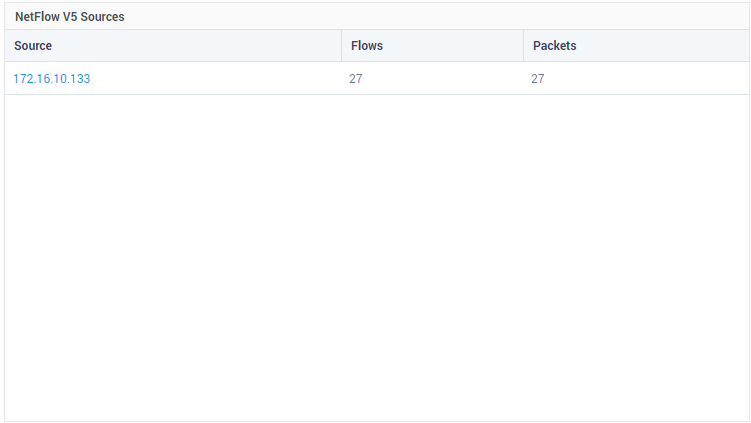
List of Sources for Flow Visualization
Field Description
Source |
Name of the source flow type. |
Flows |
Shows the number of flows started from the source type. |
Packets |
Shows the number of packets started from the source type. |
Top 10 Sources by Volume (%)
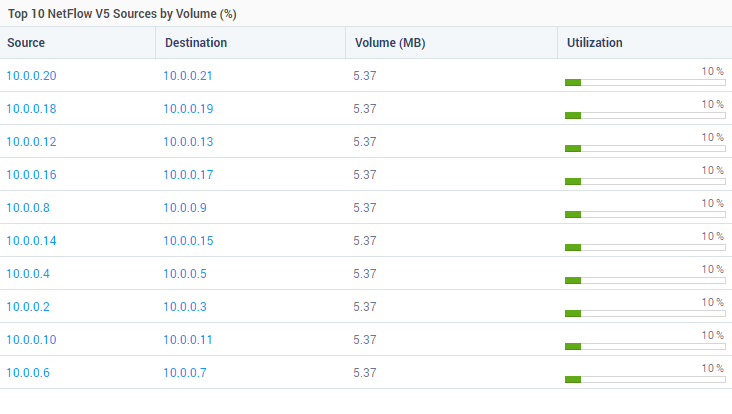
Top Sources by Volume %
Field Description
Source |
Name of the source flow type. |
Destination |
Name of the destination flow type. |
Volume (MB) |
Volume consumed by flow in MB units. |
Utilization |
Total utilization by the flow in percentage of total volume. |
Top 5 Applications
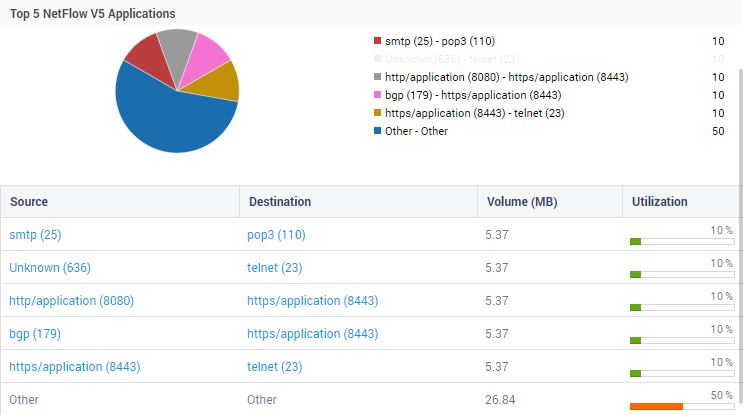
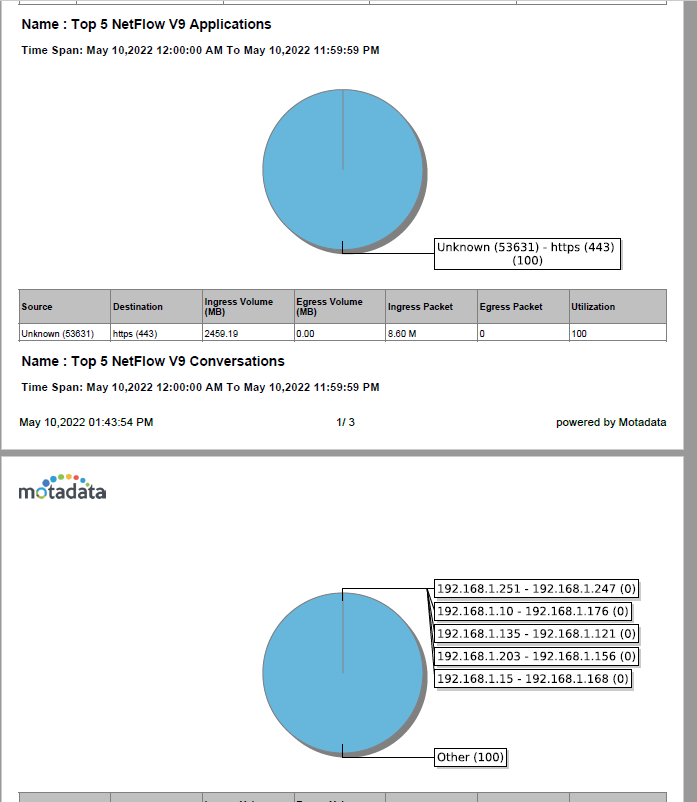
Top 5 Applications
You can also hide the application from graph. Click on the name of application in graph to hide it.
Field Description
Source |
Name of the source flow type. |
Destination |
Name of the destination flow type. |
Volume (MB) |
Volume consumed by flow in MB units. |
Utilization |
Total utilization by the flow in percentage of total volume. |
Top 5 Conversations
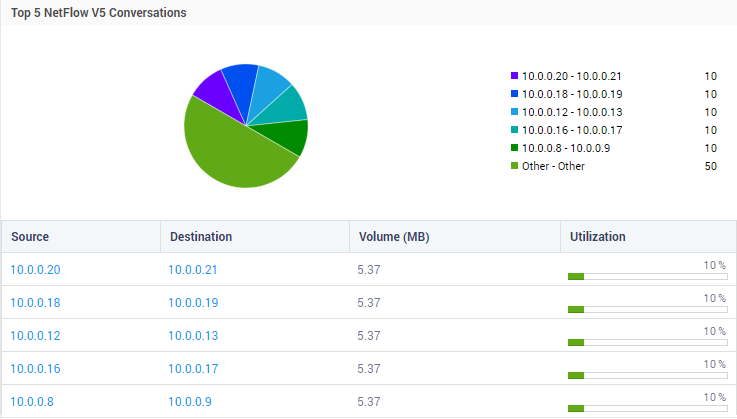
Top 5 Conversations
Field Description
Source |
Name of the source flow type. |
Destination |
Name of the destination flow type. |
Volume (MB) |
Volume consumed by flow in MB units. |
Utilization |
Total utilization by the flow in percentage of total volume. |
Top 5 End Points
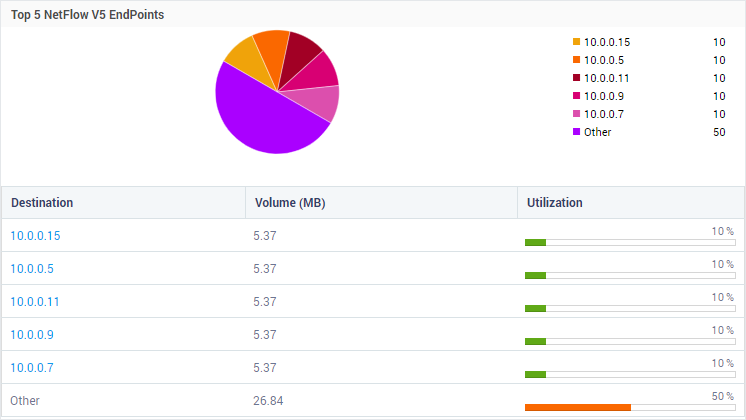
Top 5 Flow End Points
Field Description
Destination |
Name of the destination flow type. |
Volume (MB) |
Volume consumed by flow in MB units. |
Utilization |
Total utilization by the flow in percentage of total volume. |
Top 5 Protocols
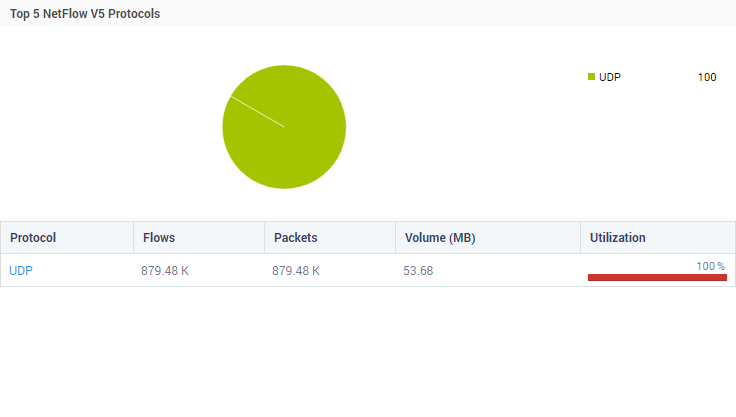
Top 5 Flow Protocols
Field Description
Protocol |
Name of the protocol |
Flows |
Number of the flows processed in the transition |
Packets |
Total No. of packets transferred |
Volume (MB) |
Volume consumed by flow in MB units. |
Utilization |
Total utilization by the flow in percentage of total volume. |